Fundamental Analysis & Fundamentals Trading Strategies
In the equities market, fundamental analysis looks to measure a company's true value and to base investments upon this type of calculation. To some extent, the same is done in the retail forex market, where forex fundamental traders evaluate currencies, and their countries, like companies and use economic announcements to gain an idea of the currency's true value.
All of the news reports, economic data and political events that come out about a country are similar to news that comes out about a stock in that it is used by investors to gain an idea of value. This value changes over time due to many factors, including economic growth and financial strength. Fundamental traders look at all of this information to evaluate a country's currency.
Given that there are practically unlimited forex fundamentals trading strategies based on fundamental data, one could write a book on this subject. To give you a better idea of a tangible trading opportunity, let's go over one of the most well-known situations, the forex carry trade. (To read some frequently asked questions about currency trading, see Common Questions About Currency Trading.)
A Breakdown of the Forex Carry Trade
The currency carry trade is a strategy in which a trader sells a currency that is offering lower interest rates and purchases a currency that offers a higher interest rate. In other words, you borrow at a low rate, and then lend at a higher rate. The trader using the strategy captures the difference between the two rates. When highly leveraging the trade, even a small difference between two rates can make the trade highly profitable. Along with capturing the rate difference, investors also will often see the value of the higher currency rise as money flows into the higher-yielding currency, which bids up its value.
Real-life examples of a yen carry trade can be found starting in 1999, whenJapan decreased its interest rates to almost zero. Investors would capitalize upon these lower interest rates and borrow a large sum of Japanese yen. The borrowed yen is then converted into U.S. dollars, which are used to buy U.S. Treasury bonds with yields and coupons at around 4.5-5%. Since the Japanese interest rate was essentially zero, the investor would be paying next to nothing to borrow the Japanese yen and earn almost all the yield on his or her U.S. Treasury bonds. But with leverage, you can greatly increase the return.
For example, 10 times leverage would create a return of 30% on a 3% yield. If you have $1,000 in your account and have access to 10 times leverage, you will control $10,000. If you implement the currency carry trade from the example above, you will earn 3% per year. At the end of the year, your $10,000 investment would equal $10,300, or a $300 gain. Because you only invested $1,000 of your own money, your real return would be 30% ($300/$1,000). However this strategy only works if the currency pair's value remains unchanged or appreciates. Therefore, most forex carry traders look not only to earn the interest rate differential, but also capital appreciation. While we've greatly simplified this transaction, the key thing to remember here is that a small difference in interest rates can result in huge gains when leverage is applied. Most currency brokers require a minimum margin to earn interest for carry trades.
However, this transaction is complicated by changes to the exchange rate between the two countries. If the lower-yielding currency appreciates against the higher-yielding currency, the gain earned between the two yields could be eliminated. The major reason that this can happen is that the risks of the higher-yielding currency are too much for investors, so they choose to invest in the lower-yielding, safer currency. Because carry trades are longer term in nature, they are susceptible to a variety of changes over time, such as rising rates in the lower-yielding currency, which attracts more investors and can lead to currency appreciation, diminishing the returns of the carry trade. This makes the future direction of the currency pair just as important as the interest rate differential itself. (To read more about currency pairs, see Using Currency Correlations To Your Advantage, Making Sense Of The Euro/Swiss Franc Relationship and Forces Behind Exchange Rates.)
To clarify this further, imagine that the interest rate in the U.S. was 5%, while the same interest rate in Russia was 10%, providing a carry trade opportunity for traders to short the U.S. dollar and to long the Russian ruble. Assume the trader borrows $1,000 US at 5% for a year and converts it into Russian rubles at a rate of 25 USD/RUB (25,000 rubles), investing the proceeds for a year. Assuming no currency changes, the 25,000 rubles grows to 27,500 and, if converted back to U.S. dollars, will be worth $1,100 US. But because the trader borrowed $1,000 US at 5%, he or she owes $1,050 US, making the net proceeds of the trade only $50.
However, imagine that there was another crisis in Russia , such as the one that was seen in 1998 when the Russian government defaulted on its debt and there was large currency devaluation in Russia as market participants sold off their Russian currency positions. If, at the end of the year the exchange rate was 50 USD/RUB, your 27,500 rubles would now convert into only $550 US (27,500 RUB x 0.02 RUB/USD). Because the trader owes $1,050 US, he or she will have lost a significant percentage of the original investment on this carry trade because of the currency's fluctuation - even though the interest rates in Russia were higher than the U.S.
Another good example of forex fundamental analysis is based on commodity prices. (To read more about this, see Commodity Prices And Currency Movements.)
You should now have an idea of some of the basic economic and fundamental ideas that underlie the forex and impact the movement of currencies. The most important thing that should be taken away from this section is that currencies and countries, like companies, are constantly changing in value based on fundamental factors such as economic growth and interest rates. You should also, based on the economic theories mentioned above, have an idea how certain economic factors impact a country's currency. We will now move on totechnical analysis, the other school of analysis that can be used to pick trades in the forex market.
Technical Analysis & TechnicaI Indicators
One of the underlying tenets of technical analysis is that historical price action predicts future price action. Since the forex is a 24-hour market, there tends to be a large amount of data that can be used to gauge future price activity, thereby increasing the statistical significance of the forecast. This makes it the perfect market for traders that use technical tools, such as trends, charts and indicators. (To learn more, see Introduction to Technical Analysis and Charting Your Way To Better Returns.)
It is important to note that, in general, the interpretation of technical analysis remains the same regardless of the asset being monitored. There are literally hundreds of books dedicated to this field of study, but in this tutorial we will only touch on the basics of why technical analysis is such a popular tool in the forex market.
As the specific techniques of technical analysis are discussed in other tutorials, we will focus on the more forex-specific aspects of technical analysis.
Technical Analysis Discounts Everything; Especially in Forex
Minimal Rate Inconsistency
There are many large players in the forex market, such as hedge funds and large banks, that all have advanced computer systems to constantly monitor any inconsistencies between the different currency pairs. Given these programs, it is rare to see any major inconsistency last longer than a matter of seconds. Many traders turn to forex technical analysis because it presumes that all the factors that influence a price - economic, political, social and psychological - have already been factored into the current exchange rate by the market. With so many investors and so much money exchanging hands each day, the trend and flow of capital is what becomes important, rather than attempting to identify a mispriced rate.
Trend or Range
One of the greatest goals of technical traders in the FX market is to determine whether a given pair will trend in a certain direction, or if it will travel sideways and remain range-bound. The most common method to determine these characteristics is to draw trend lines that connect historical levels that have prevented a rate from heading higher or lower. These levels of support and resistance are used by technical traders to determine whether or not the given trend, or lack of trend, will continue.
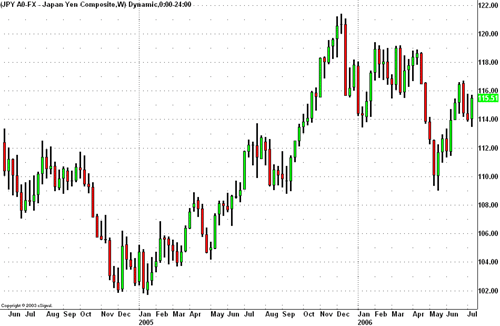
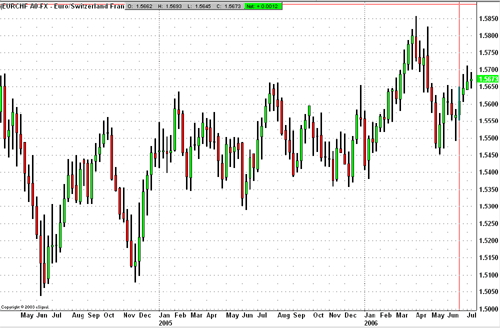
Generally, the major currency pairs - such as the EUR/USD, USD/JPY, USD/CHF and GBP/USD - have shown the greatest characteristics of trend, while the currency pairs that have historically shown a higher probability of becoming range-bound have been the currency crosses (pairs not involving the U.S. dollar). The two charts below show the strong trending nature of USD/JPY in contrast to the range-bound nature of EUR/CHF. It is important for every trader to be aware of the characteristics of trend and range, because they will not only affect what pairs are traded, but also what type of strategy should be used. (To learn more about this subject, see Trading Trend Or Range?)
 |
| Graph created by E-Signal. |
| Figure 1 |

Graph created by E-Signal. Figure 2
Common Indicators
Technical traders use many different indicators in combination with support and resistance to aid them in predicting the future direction of exchange rates. Again, learning how to interpret various forex technical indicators is a study unto itself and goes beyond the scope of this forex tutorial. If you wish to learn more about this subject, we suggest you read our technical analysis tutorial.
A few indicators that we feel we should mention, due to their popularity, are: Bollinger Bands®, Fibonacci retracement, moving averages, moving average convergence divergence (MACD) and stochastics. These technical tools are rarely used by themselves to generate signals, but rather in conjunction with other indicators and chart patterns.
No comments:
Post a Comment